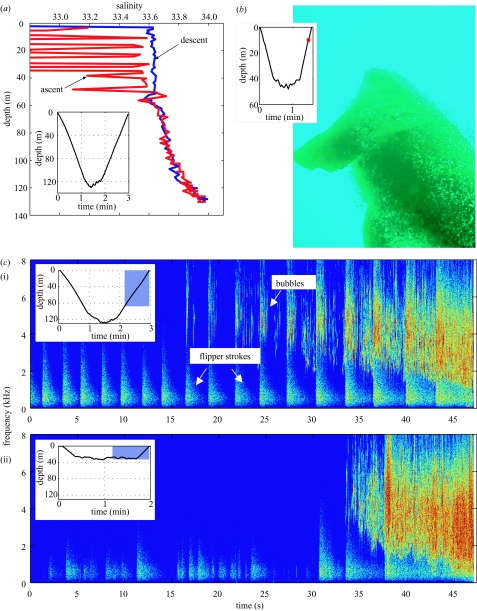
Figure 1.
Ascent exhalations recorded by three data sources. (a) Salinity record from a dive to 125 m, showing anomalies apparent in the results during the later portion of ascent. (b) Digital photograph taken from a neck-mounted camera showing another ascending seal. (c) Spectrograms showing the bubble sounds heard during ascent from a deep dive to 125 m (i), and a shallow dive to 35 m (ii). Insets show time and depth profiles for each dive from which data are shown, either for the whole dive (a), with position of record shown by dot (b), or section of dive highlighted from which spectrogram is plotted (c).

