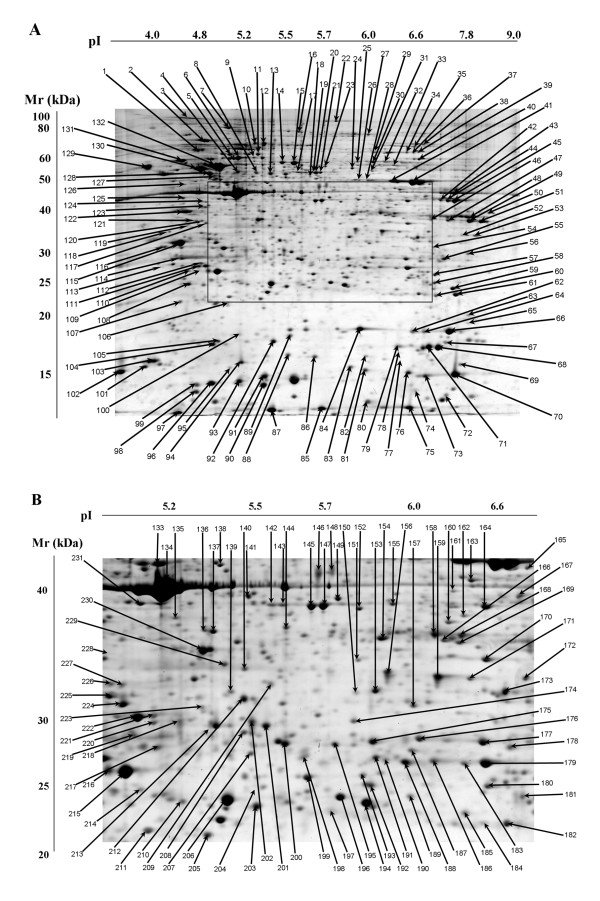
Figure 2.
Monocyte proteome map. (A) 2D gel of blood monocytes. Arrows point to abundant proteins with protein identity determined by tandem mass spectrometry. (B) Detailed illustration of the central area of Figure 2A. Arrows illustrate protein spots in the central area that have information on protein identity.

