
FIG. 1.
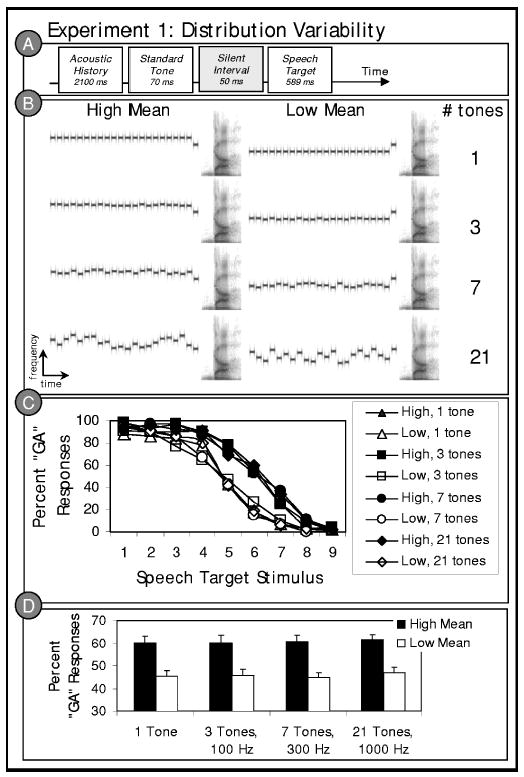
Stimulus structure and results of experiment 1. (a) Schematic illustration of the experiment 1 stimulus structure based on the paradigm of Holt (2005); (b) a representive stimulus spectrogram from each of the eight (2 Mean×4 Variability) conditions; (c) listeners’ average “ga” categorization responses to the /ga/ to /da/ series stimuli in the context of preceding high and low mean acoustic histories with 1 tone at the mean frequency, 3 tones sampling 100 Hz around the mean frequency, 7 tones sampling 300 Hz around the mean frequency, or 21 tones sampling 1000 Hz around the mean frequency; and (d) average “ga” categorization responses collapsed across the target stimulus series as a function of the distribution characteristics of the acoustic history precursors.