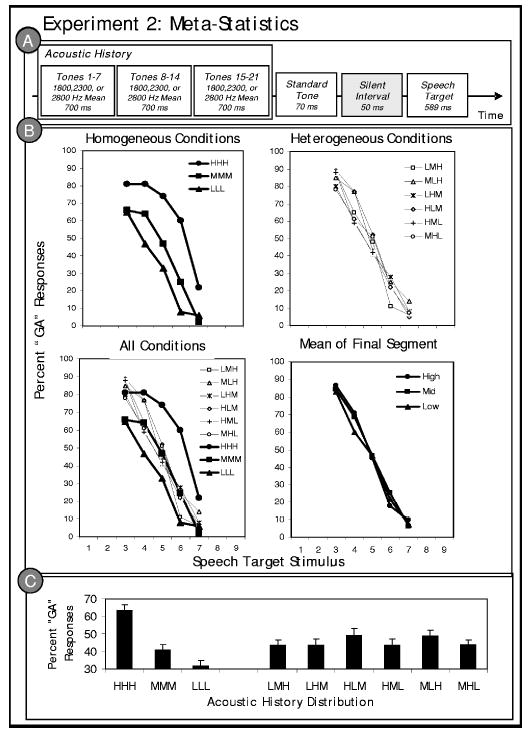
FIG. 3.

Stimulus structure and results of experiment 2. (a) Schematic illustration of the experiment 2 stimulus structure; (b) listeners’ average “ga” categorization responses to the /ga/ to /da/ series stimuli in the context of preceding acoustic histories. In the top left panel, the thick, solid lines depict speech categorization in the context of the homogeneous acoustic history conditions for which there was only global regularity. In the top right panel, the dashed lines illustrate categorization in the context of the hetergeneous acoustic histories with an intermediate global mean of 2300 Hz and local regularities within 7-tone subelements. The bottom left panel combines the data from the two former graphs. The bottom right panel shows the data as a function of the frequency of the distribution mean of the final subsequence immediately preceding the speech target; and (c) average “ga” categorization responses collapsed across the target stimulus series as a function of the distribution characteristics of the acoustic history precursors.
