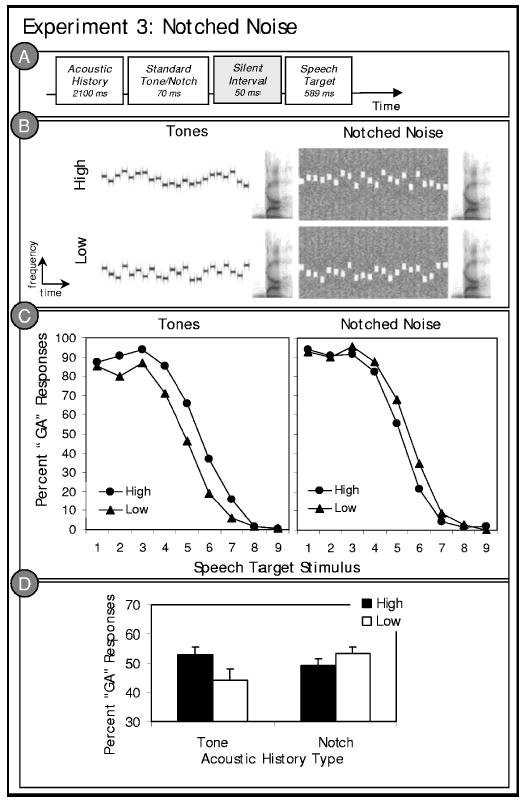
FIG. 4.

Stimulus structure and results of experiment 3. (a) Schematic illustration of the experiment 3 stimulus structure; (b) example spectrograms illustrating a high mean and a low mean stimulus token from the notched noise and tone acoustic histories of experiment 3. Note that the tone acoustic histories possess energy where the notched noise acoustic histories lack energy. (c) The left panel illustrates listeners’ average “ga” categorization responses to the /ga/ to /da/ stimulus series as a function of the tone acoustic history contexts. The right panel shows the same listeners’ responses to the same speech stimuli preceded by notched noise acoustic history contexts. (d) Average “ga” categorization responses collapsed across the target stimulus series as a function of the distribution characteristics of the acoustic history precursors.
