
Figure 3.
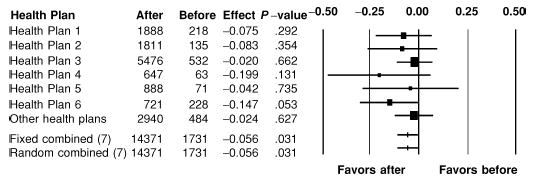
Completion of treatment goals. Shown are the effect sizes (and 95% confidence intervals) for the before minus after differences in completion of at least two thirds of treatment goals (based on residuals reflecting adjustments for subjects’ demographic and clinical characteristics as well as health plan main effects). Marker size reflects numbers of health plan patients.