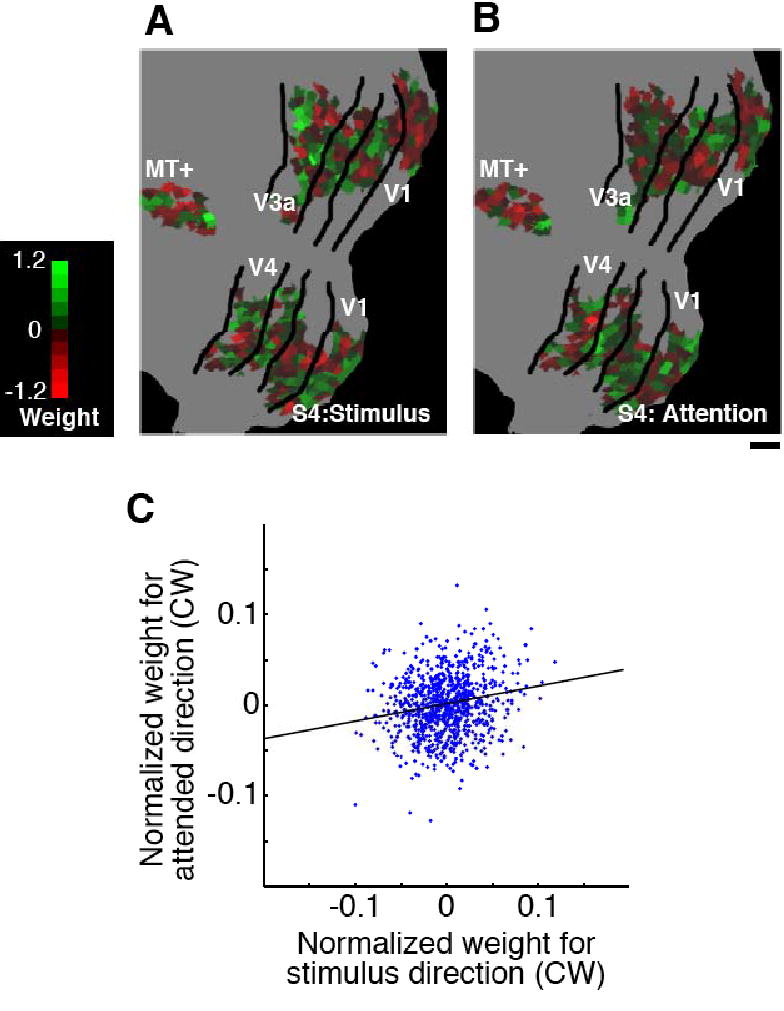
Supplemental Figure 2.

Comparison of preference/weight maps for stimulus motion direction and attended direction. (A, B) Maps of the weights calculated to discriminate two rotational motion directions for stimulus direction (A), and for attended direction (B) (subject S4; V1-MT+ 900 voxels; scale bar, 1 cm). Color indicates the sign and amplitude of the weights for clockwise motion (flipped signs for counterclockwise motion). (C) Correlation between the weights for stimulus and attended direction. The scatter plot shows the normalized weights for stimulus and attended direction (clockwise) for each voxel (subject S4). The solid line indicates the regression line for these two sets of weights. Although there is no apparent similarity between the two weight maps (A and B), their correlation was statistically significant (correlation coefficient, 0.14 ±0.04; P < 0.001 in all 4 subjects).
