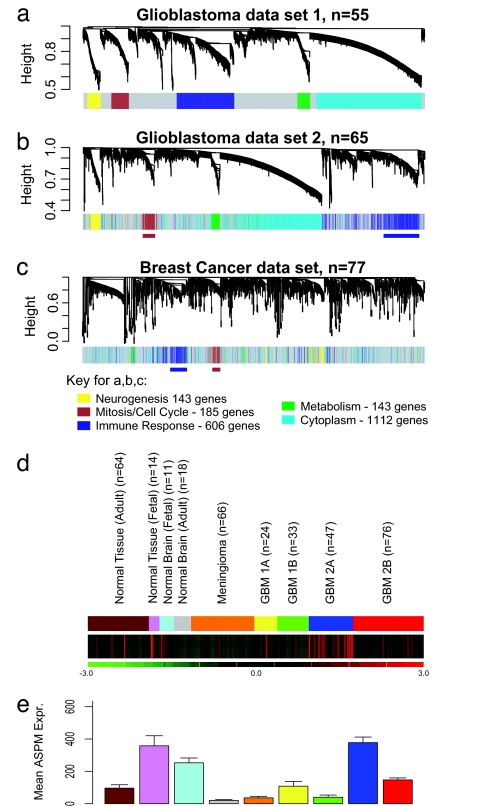
Fig. 1.
Detection of gene coexpression modules in glioblastoma and breast cancer. (a) In glioblastoma data set 1, five gene coexpression modules were detected. (b) The network genes derived from data set 1 were mapped to data set 2. The genes maintain the same color coding for module association from data set 1, facilitating visual inspection of module conservation. The same module association in both data sets was found for 87.4% of genes (P = 2.2 × 10⁻¹⁶). (c) Two of the five glioblastoma modules (brown, cell cycle mitosis; blue, immune response) were detected in a set of 77 breast cancer samples. (d) The green/red expression diagram shows the relative expression of the module across 353 samples, including 180 glioblastomas, 66 meningiomas, 64 normal adult body tissues of different types, 18 adult normal brain tissue samples, 11 fetal brain tissue samples, and 14 fetal nonbrain tissue samples. The MCM is highly expressed in only a subset of glioblastomas (type 2A) (12), and its expression pattern is similar to a fetal proliferation signature. (e) Mean expression of ASPM in the 353 clinical samples, including glioblastomas, meningiomas, normal brain, normal body tissues, fetal brain, and fetal body tissues.

