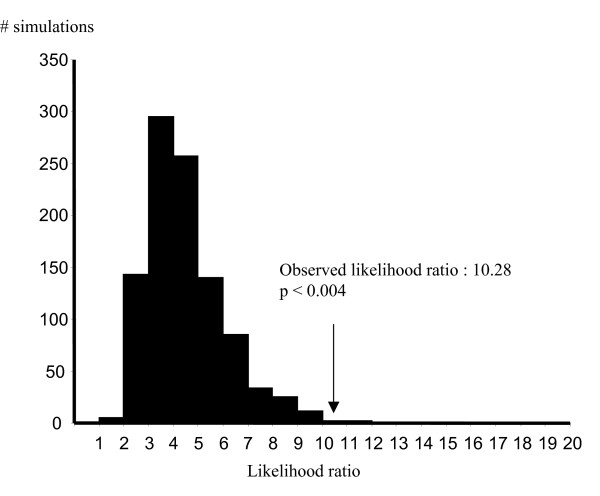
Figure 3.
Distribution of the likelihood ratios expected by chance. The distribution of likelihood ratios for the null hypothesis (i.e. no recombination) is shown. The y-axis shows the number of simulations. Likelihood ratios are shown at the bottom of the figure. The arrow shows the likelihood ratio obtained for the real dataset for the putative recombinant strain.

