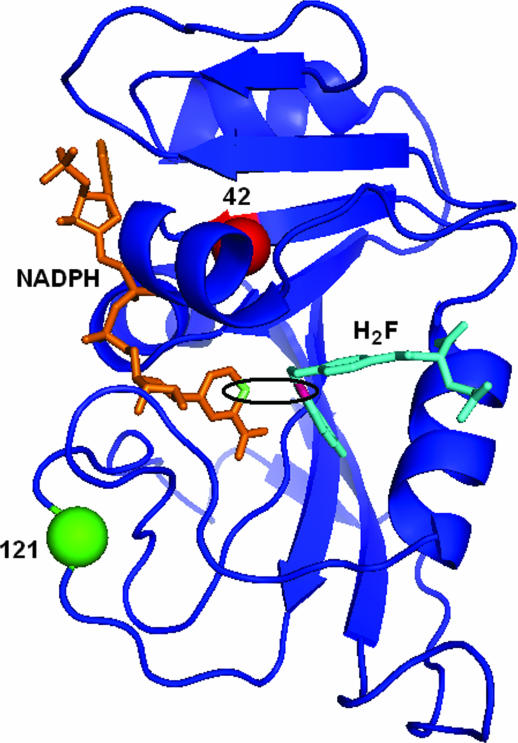
Fig. 1.
A 3D structure of WT ecDHFR with the cofactor, NADPH, shown in orange and the substrate, H2F, shown in cyan. The C4 position of NADPH and the C6 position of H2F are highlighted in lime and pink, respectively. The active site is emphasized by the black ellipse. Residues 121 and 42 are labeled with green and red spheres, respectively.

