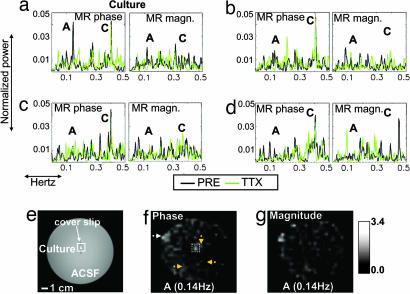
Fig. 4.
Imaging results obtained for one culture. (a) Single-voxel phase and magnitude spectra for the culture region. (b–d) Single-voxel phase and magnitude spectra for three artificial cerebrospinal fluid (ACSF) locations. A peak corresponding to the culture site is observed solely in the PRE phase spectrum, marked as A (≈0.14 Hz), possibly representing the activation burst frequency of the culture. The spectral peak marked as C corresponds to the scanner cooling-pump frequency and is present in all conditions. (e) Structural fast-spin-echo image obtained during the same MR session. (f and g) Phase map (f) and magnitude map (g), showing the difference in signal power between the PRE and TTX conditions for peak A. The spectra shown in a correspond to a voxel in the culture area indicated by the box in e and f. The spectra shown in (b–d) are marked by orange arrows on the phase map (clockwise from culture). The increased signal power for peak A is localized on the culture in the phase map, seen also in the overplot of A on the anatomical image in e. The high-intensity region indicated by the white arrow (f, upper left) reflects elevated signal power in the PRE state at all frequencies, possibly due to hardware instabilities or imperfect shimming.

