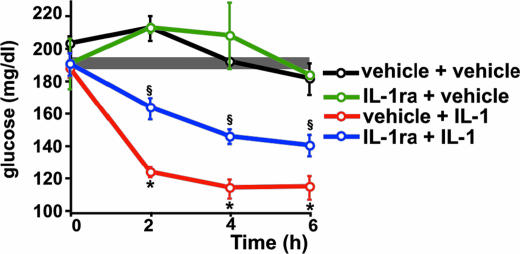
Fig. 2.
Blockade of IL-1 receptors in the brain interferes with IL-1-induced hypoglycemia. IImmediately after a blood sample was obtained (time 0), IL-1ra (50 μg in 5 μl of vehicle) or the vehicle alone was injected i.c.v., and IL-1 (0.1 μg per mouse) or the vehicle was injected i.p. Additional blood samples were collected at the times indicated and used for glucose determinations. Each point in the curves represents the mean ± SEM from determinations performed in three (in groups with control i.p) and six to eight (in groups with IL-1 i.p.) mice per group. ∗, P < 0.001 vs. control + vehicle and vs. control + IL-1ra; §, P < 0.005 vs. all other groups. The shaded area indicates the range of the mean ± SEM of time 0 from all groups together.

