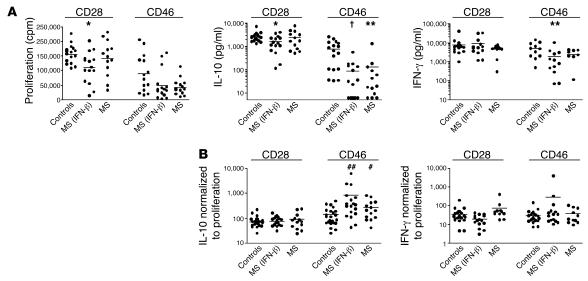
Figure 1. Decreases in IL-10 secretion were specific to CD46 and not CD28 costimulation.
(A) Proliferation and cytokine production upon CD28 and CD46 stimulation. CD4+ T cells from controls or either treated [MS (IFN-β)] or untreated (MS) patients with MS were stimulated with anti-CD3/CD28 or anti-CD3/CD46 mAbs (2 μg/ml) in the presence of IL-2 (10 U/ml). After 3 days, supernatants were harvested; proliferation was assessed by [3H]thymidine incorporation; and IL-10 and IFN-γ concentrations were quantified by ELISA. There were significant decreases in CD28-costimulated proliferation in the treated patients as compared with the control subjects (left; *P = 0.0137). There was a decrease in CD46-mediated IL-10 secretion in treated (6-fold decrease; †P < 0.0001) and untreated (4-fold decrease; **P = 0.0038) patients with MS, compared with control subjects (middle). There were modest decreases in IFN-γ secretion in patients with MS compared with control subjects (right panel; **P = 0.0098). Average IL-10 production (pg/ml): CD28 stimulation: controls = 2,599, MS (IFN-β) = 1,580, MS = 2,393; CD46 stimulation: controls = 1,261, MS (IFN-β) = 210, MS = 325. Average IFN-γ secretion (pg/ml): CD28 stimulation: controls = 7,786, MS (IFN-β) = 9,176 MS = 4,289; CD46 stimulation: controls = 4,996, MS (IFN-β) = 1,826, MS = 2,324. (B) The levels of cytokine secreted were normalized to the proliferation by calculating the ratio of proliferation to cytokine production. The decrease in CD46-mediated IL-10 secretion was not simply due to an inability of CD4+ cells to enter into cell cycle, as a significant difference was observed with normalization of IL-10 (left panel) but not IFN-γ (right panel) secretion to proliferation (almost 6-fold difference for the treated group [##P = 0.0026] and 2-fold difference for the untreated group [#P = 0.0403]).

