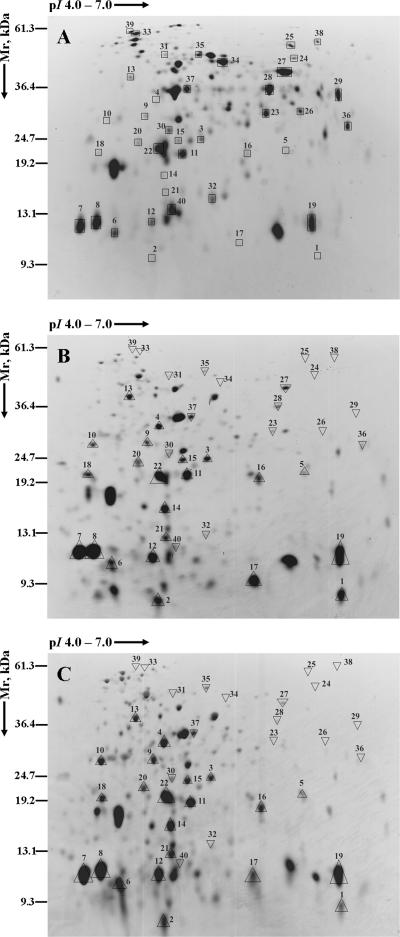
FIG. 5.
Total protein pI values ranging from 4 to 7 for proteins which were differentially expressed in biofilms adapted to BC. The images illustrate the representative 2D-polyacrylamide gels pertaining to proteins extracted from untreated control biofilms (A), biofilms adapted to continuous treatment of BC (1 μg ml−1) (B), and biofilms adapted to intermittent treatment of BC (10 μg ml−1 for 10 min daily) (C). The description of the proteins and their levels of expression are illustrated in Table 1 (up-regulation) and Table 2 (down-regulation). □, locations of the protein spots in the control; ▵, up-regulation; ▿, down-regulation of the protein relative to the expression in untreated control biofilms.

