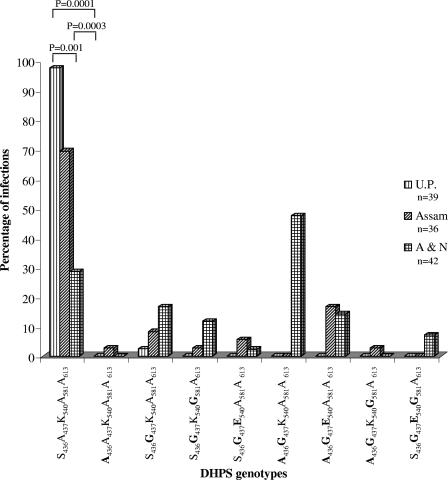
FIG. 2.
Regional distribution of DHPS genotypes among P. falciparum isolates. Amino acid sequences for each genotype at codons 436, 437, 540, 581, and 613 are shown along the x axis. The chi-square test with Yate's correction was used to compare the values between two regions. Only significant P values are shown at the top of the bars. The mutated amino acids are shown in boldface. n, number of isolates sequenced, which may or may not be equal to the number of samples due to multiple infections per sample.

