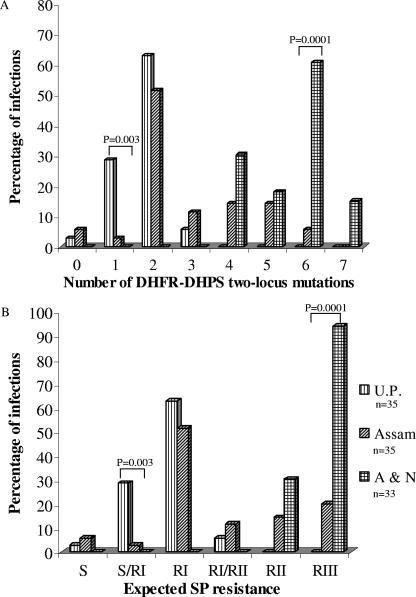
FIG. 3.
Regional distribution of DHFR-DHPS two-locus mutations (A) and expected SPR (B). The expected clinical resistance was derived from the combined DHFR and DHPS genotypes, as described in the text and Ahmed et al. (1). The chi-square test with Yate's correction was used to compare the values between two regions. Only significant P values are shown at the top of the bars. n, number of isolates sequenced, which may or may not be equal to the number of samples due to multiple infections per sample.

