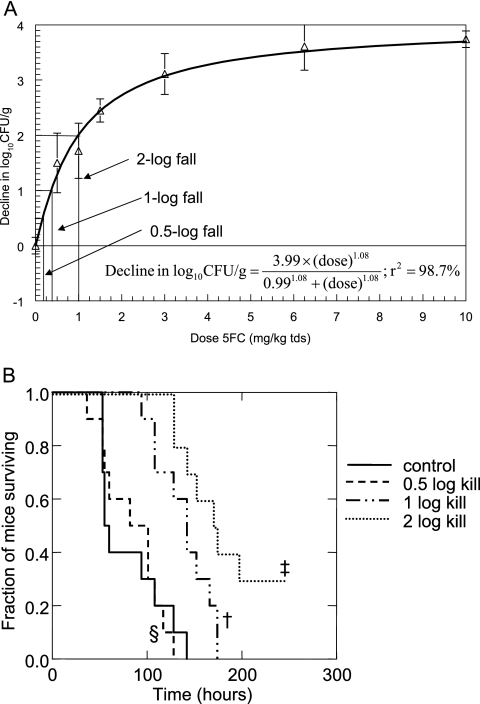
FIG. 1.
(A) Sigmoid-Emax relationship for isolate F/6862 (MIC, 0.125 mg/liter). Data are means ± SD. The doses producing 0.5-, 1-, and 2-log falls in log10CFU/g were 0.18, 0.37, and 1 mg/kg administered every 8 h, respectively. (B) Kaplan-Meier survival curves for groups of mice infected with strain F/6862 (MIC, 0.125 mg/liter) following 24 h of 5FC therapy, to further examine the consequences of various degrees of antifungal killing. ‡, 2-log drop versus 1-log drop, P = 0.039; †, 1-log drop versus control, P = 0.002; §, 0.5-log drop versus control, P = 0.854.

