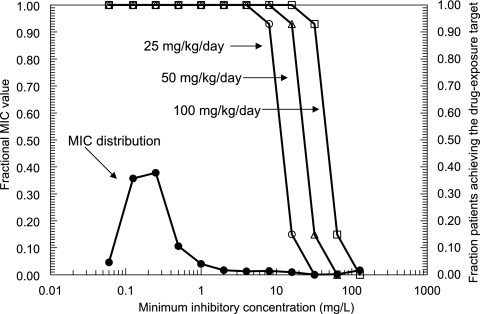
FIG. 3.
Fraction of the 9,999 simulated patients which achieved the drug exposure target (i.e., serum 5FC concentrations greater than the MIC for at least 45% of the dosing interval) following the administration of 5FC at 25, 50 and 100 mg/kg/day, depicted by open circles, triangles, and squares, respectively. The distribution of the MICs for 1,941 C. albicans isolates, obtained using the EUCAST method, is shown by the solid circles.

