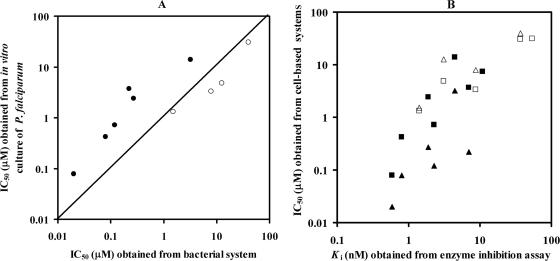
FIG. 2.
Graphics show inhibition of Pyr analogs. (A) Correlation of IC50s derived from bacterial complementation assay and in vitro culture of P. falciparum assay. (B) Relationship between IC50s obtained from cell-based assay systems (either parasite [square] or bacteria [triangle]) and the Ki values from the in vitro enzyme inhibition assay. Closed and open symbols are data points derived from the wild type and the mutant, respectively (data with Ki values and IC50s greater than 60 nM and 50 μM were excluded from the plot). Each data point is the average from at least three independent experiments (each performed in triplicate).

