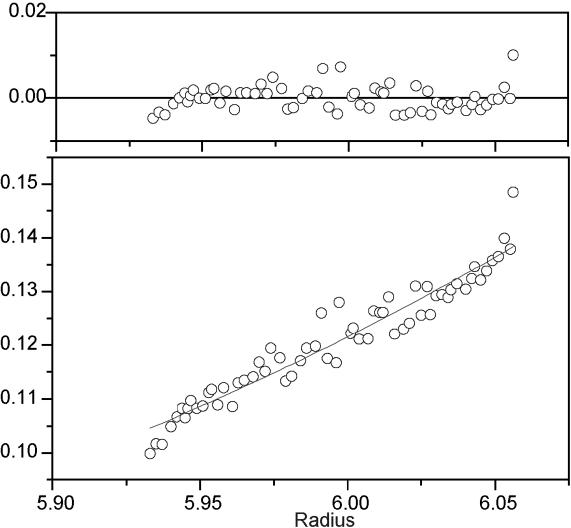
Figure 4.
Sedimentation equilibrium of the T2 domain. The sedimentation equilibrium profile of T2 (at 0.14 mg ml−1) in 10% glycerol is shown. The experiment was performed using an Optima™ XLA at 3000 r.p.m., 20°C and the scans taken at 280 nm every 5 h over 24 h. The fitted curve is for a single-species model with Mr = 430 kDa.

