Figure 5.
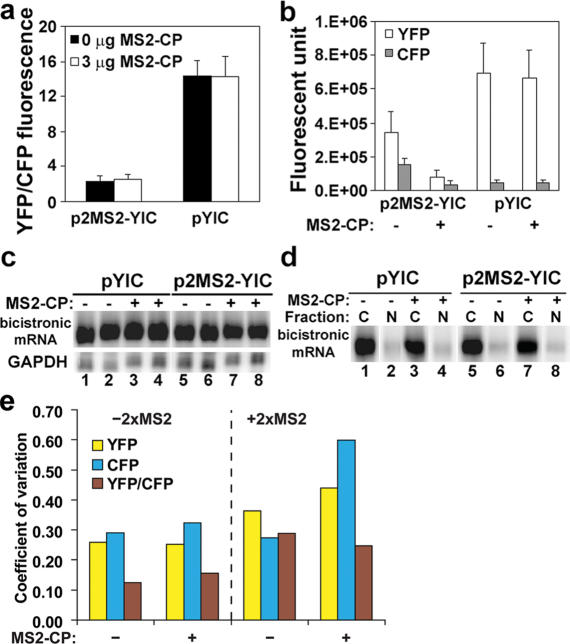
Different mode of translational repression by MS2-CP. (a) Effect of MS2-CP on relative YFP/CFP fluorescence. The 293T cells grown in 35 mm dishes were transfected with 1 μg of p2MS2-YIC or control pYIC DNA along with no or 3 μg MS2-CP expression DNA and analyzed for YFP/CFP fluorescence 24 h after transfection. MS2-CP had no significant effect on YFP/CFP fluorescence (P-value = 0.20 for 2xMS2-containing bicistronic gene; P-value = 0.97 for 2xMS2-lacking bicistronic gene). (b) Analysis of individual fluorescence. Mean of YFP and CFP fluorescence for a 10-pixel circle from cells analyzed in (a) are plotted as arbitrary fluorescence unit (n = 30). Error bar is SD. Note MS2-CP significantly decreased 2xMS2-containing bicistronic gene activity 4-fold (P-value = 4.10 × 10⁻¹¹ for YFP fluorescence and P-value = 5.52 × 10⁻¹¹ for CFP fluorescence) but had no significant effect on 2xMS2-lacking bicistronic gene activity (P-value = 0.48 for YFP fluorescence and P-value = 0.51 for CFP fluorescence). (c) Northern blot analysis of total RNA. Duplicate transfections performed at the same time as in (a) were analyzed for presence of bicistronic (upper panels) or GAPDH (lower panels) mRNAs using 32P-labeled RNA probes. Images collected on PhosphorImager (Molecular Dynamics) are shown. (d) Effect of MS2-CP on nuclear/cytoplasmic partition of bicistronic mRNA. Northern blot analysis on duplicate samples fractionated for cytoplasm (odd) or nucleus (even) were analyzed for presence of bicistronic mRNA, as in (c). Ethidium bromide staining of gel fractionated RNAs revealed expected presence of precursor rRNA in the nuclear but not cytoplasmic fraction (data not shown). (e) Coefficient of variation for the fluorescence data in (a and b). Unlike the previous three RNA–protein interactions which led to an increase in the coefficient of variation for YFP/CFP fluorescence ratio, MS2-CP failed to cause an increase in this coefficient for the 2xMS2-containing bicistronic reporter gene (compare brown bar of ‘+2xMS2, −MS2-CP’ with that of ‘+2xMS2, +MS2-CP’). The slight decrease observed is not statistically significant as the Wilcoxon rank sum test gave a P-value = 0.20. This failure to cause a rise in the coefficient of variation for YFP/CFP fluorescence ratio probably reflects a different mechanism of translational repression through the 5′-UTR, namely translational repression of the entire bicistronic reporter transcript with the 2xMS2 site in the presence of MS2-CP. +2xMS2 and −2xMS2 refer to p2MS2-YIC and pYIC samples in (a) and (b), respectively.

