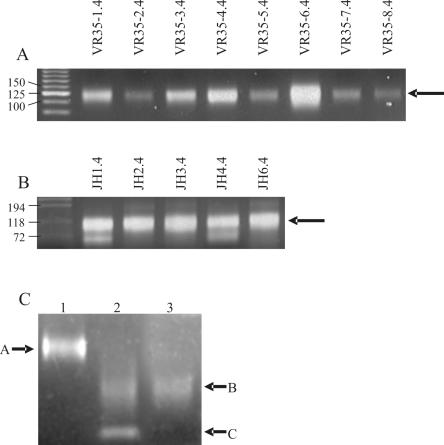
Figure 3.
PCR amplification of lymphocyte cDNA using a mixture of the 3′ J region primers and individual 5′ V gene primers (a), or a mixture of the 5′ V gene primers and the individual J region primers (b). In (c), the pooled PCR product prior to digestion is shown in lane 1. In lane 2 the PCR product after digestion with BpmI, and in lane 3 the product after the biotinylated primers are removed. In each case the arrows show the amplified HCDR3s except C in 3c.

