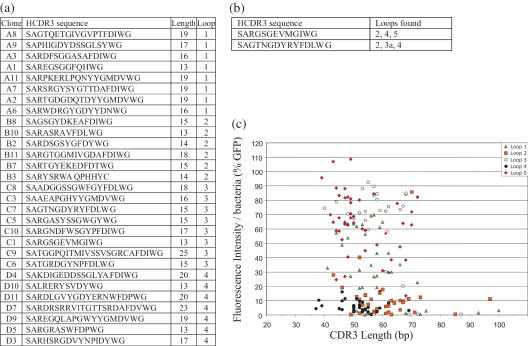
Figure 6.
(a) Shows the sequence of random HCDR3s cloned into the different loops. In (b) are shown two HCDR3 sequences whose sequences were found in different loops. (c) Shows the correlation between HCDR3 length and bacterial fluorescence as expressed as a percentage of the fluorescence of bacteria expressing GFP.

