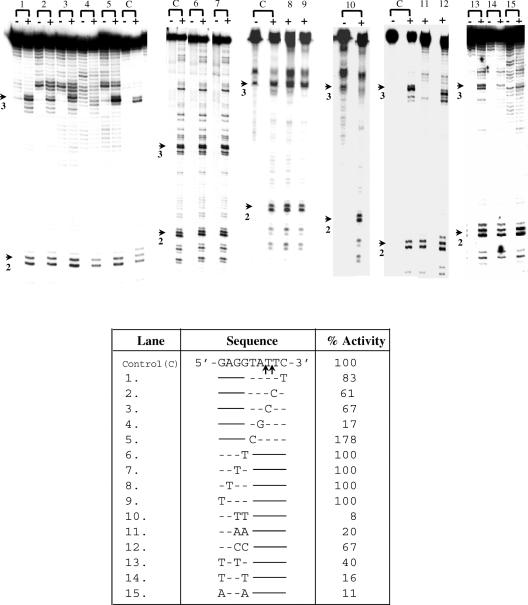
Figure 3.
Nicking activity on substrates mutated in site # 3 and containing a normal site #2. Table shows bottom strand sequence of nucleotides surrounding the nicks in site #3 (Figure 1) in the control (C) and the various point mutations tested (lanes 1–15). Only the altered nucleotides are indicated. Substrates of length 117 bp were obtained by PCR amplification from the 176 bp template (position 60 to 176, Figure 1). The mutations were incorporated in the PCR primers. Lanes marked (–) were reactions without EN. The enzyme activity obtained for each substrate was quantitated using the normal site #2 as internal control, and was expressed as % activity obtained for normal site #3. The values in the table are average of three experiments. Arrows indicate position of nicks in site #2 and 3.

