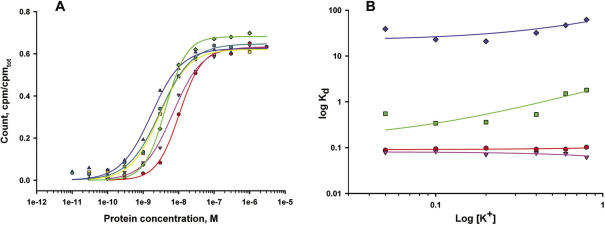
Figure 10.
Ionic strength dependence of RNA-binding of archaeal complexes L10/L124. (A) Typical binding curves for the interaction of L10/L124 from M.thermolithotrophicus with the Mja23S-95 rRNA fragment in the presence of different concentrations KCl. 800 mM (red), 600 mM (pink), 400 mM (green), 200 mM (yellow), 100 mM (blue), 50 mM (cyan). The fit theoretical curves are marked with corresponding colors. (B) Kd's for the interaction of L10/L124 from M.igneus (red), M.jannaschii (pink), M.thermolithotrophicus (green) and M.vannielii (blue) with the specific Mja23S rRNA fragment were determined with the same KCl concentrations (50–800 mM) and shown as a log–log plot. The best fit theoretical lines are marked with corresponding colors.

