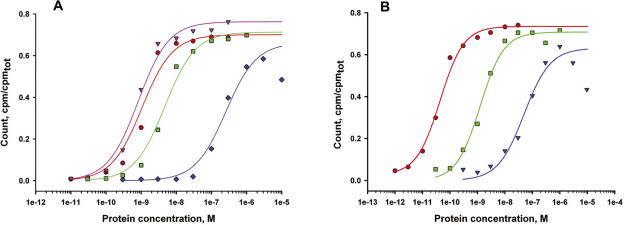
Figure 8.
Typical binding curves for the interaction of archaeal (A) and bacterial (B) stalk complexes with specific 23S rRNA fragments. (A): binding of L10/L124 from M.igneus (red), M.jannaschii (pink), M.thermolithotrophicus (green) and M.vannielii (blue) to the Mja23S-95 rRNA fragment; (B): binding of L10/L126 from T.thermophilus (red), L10/L124 from G.stearothermophilus (green) and E.coli (blue) to specific 23S rRNA fragments from the same organisms. The fit theoretical curves are marked with corresponding colors.

