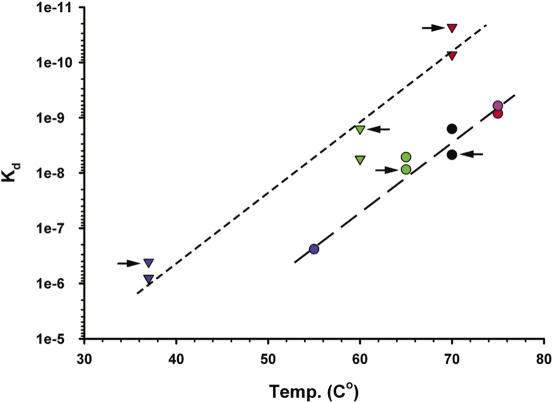
Figure 9.
The correlation between Kd values characterizing the interaction of bacterial and archaeal L10–L12 complexes with their 23S rRNA target sites summarized in Table 3 and thermostability of stalk complexes. Triangles: bacterial complexes from T.thermophilus (red), G.stearothermophilus (green) and E.coli (blue). Circles: archaeal complexes from M.igneus (red), M.jannaschii (pink), S.solfataricus (black), M.thermolithotrophicus (green) and M.vannielii (blue). Points reflecting interaction of the stalk complexes with homologous RNA fragments are marked with arrows.

