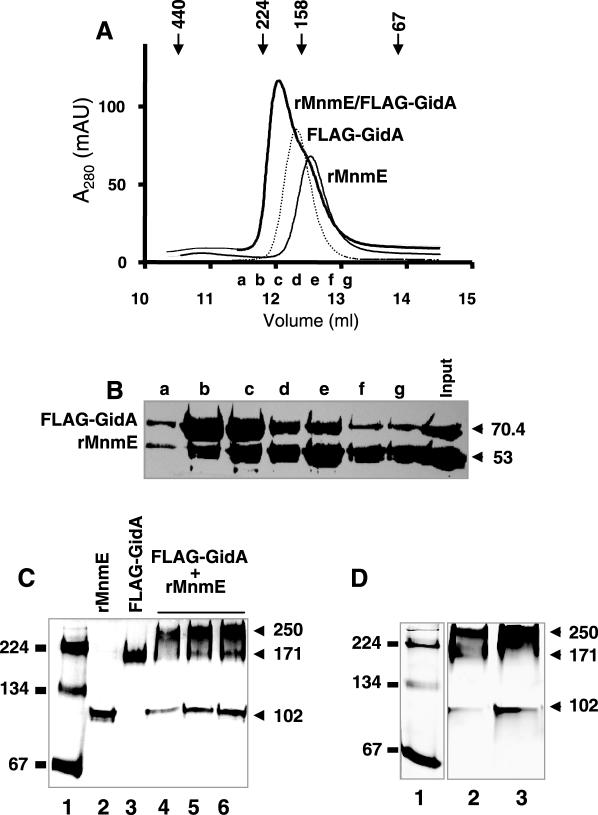
Figure 5.
GidA and MnmE form an α2β2 heterotetrameric complex. (A) Estimation of the molecular mass of the peak fractions in preparations of rMnmE, FLAG-GidA and a FLAG-GidA/rMnmE mix by gel-filtration chromatography. The major peaks from each preparation eluted at 149, 168 and 195 kDa, respectively. Markers indicate the positions of the standards: ferritin (440 kDa), β-amylase (224 kDa), aldolase (158 kDa), albumin (67 kDa). Elution fractions a to g from chromatography of the FLAG-GidA/MnmE mix were pooled for further analysis. (B) SDS–PAGE of elution fractions a to g from the FLAG-GidA/rMnmE mix chromatography showed in (A). Fractions (250 μl) were precipitated with trichloroacetic acid before loading. The gel was stained with Coomassie blue. Molecular masses are indicated on the right in kDa. (C) Native PAGE analysis of rMnmE, FLAG-GidA and a mix of FLAG-GidA/rMnmE. Lane 1: Molecular mass markers were β-amylase and albumin (monomer and dimer). Lane 2: 10 μg of rMnmE. Lane 3: 10 μg of FLAG-GidA. Lanes 4–6: 15, 30, and 40 μg, respectively, of total protein from a FLAG-GidA/rMnmE mix prepared as indicated in Materials and Methods. Positions of mass markers and their size in kilodaltons are indicated on the left. Positions of rMnmE, FLAG-GidA and FLAG-GidA•rMnmE specific complexes are indicated on the right, together with the apparent molecular mass of the complexes. (D) Native PAGE of fractions coming from gel-filtration of a FLAG-GidA/rMnmE mix. Lane 1: molecular mass markers were as (C), Lanes 2 and 3: elution fractions b and c, respectively, from an experiment like that shown in (A). Size of the mass markers and complexes are indicated on the right and left, respectively. Note correspondence between complexes detected here and those of (C).

