Figure 3.
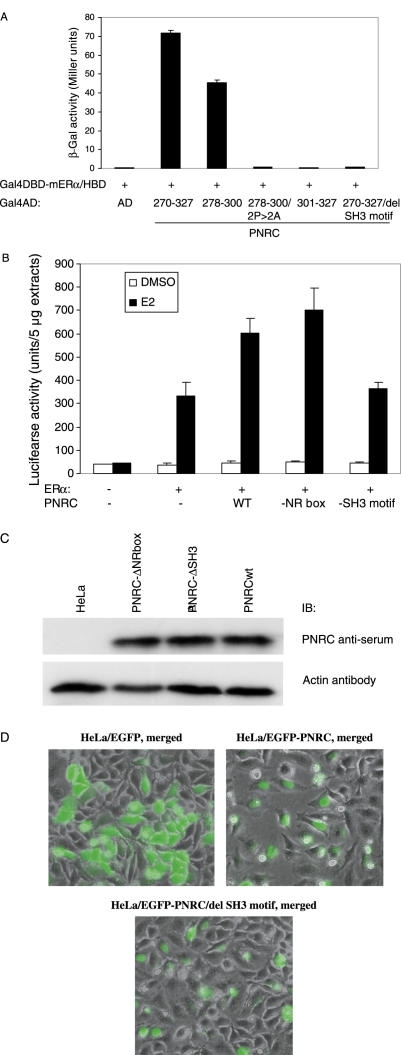
SH3-binding motif within amino acid region 278–300 is essential for PNRC to interact with ERα and function as coactivator of ERα. (A) Yeast strain, Y187, was cotransformed with pGBT9–mERα/HBD and the expression plasmid for ADGal4 (AD, in pACT2 vector) or an yeast expression plasmid for the fusion proteins of ADGal4 and various deletion mutants of PNRC as indicated. The yeast transformants bearing both plasmids were cultured in the absence (data not shown) or presence of 17-β-estradiol (10 nM). β-Galactosidase activities were determined and expressed as the mean (units) ± SD of three independent colonies. (B) HeLa cells cultured in 6-well plates were transfected with pGL3(ERE)_SV40_Luciferase reporter (0.25 μg) alone or along with pSG5–ERα (50 ng) or pSG5–ERα (50 ng) plus pCI–PNRC (WT), pCI–PNRC/del NR box (−NR box), or pCI–PNRC/del SH3 motif (−SH3 motif) (1 μg each). Four hours after transfection, cells were cultured in the presence of 10 nM 17-β-estradiol (E2) or DMSO (the vehicle control) for additional 20 h. Twenty-four hours after transfection, cells were harvested, lysed and the luciferase activities in the cell lysate from triplicate wells were measured as described in the Materials and Methods, and expressed as mean ± SD of three independent assays. (C) Western blot analysis. Twenty-five microgram extract prepared from non-transfected HeLa cells (HeLa) or from pCI–PNRC/del NR box (PNRC − NR box), pCI–PNRC/del SH3 (PNRC − SH3), or pCI–PNRC WT (PNRCwt) transfected HeLa cells was subjected to 10% SDS–PAGE and western blot analysis using PNRC antiserum and β-actin antibody, respectively, as described in the Materials and Methods. (D) Cellular localization of wild-type PNRC and PNRC/del SH3 motif. HeLa cells in 6-well dish were transfected with pEGFP, pEGFP-PNRCwt or pEGFP–PNRC/del SH3 motif. Twenty-four hours after transfection, the images of the expressed fluorescent proteins in transfected HeLa cells were taken using a fluorescence microscope. The images shown are the merged images of bright field images (whole cells) and green fluorescence image (expressed fluorescent proteins).

