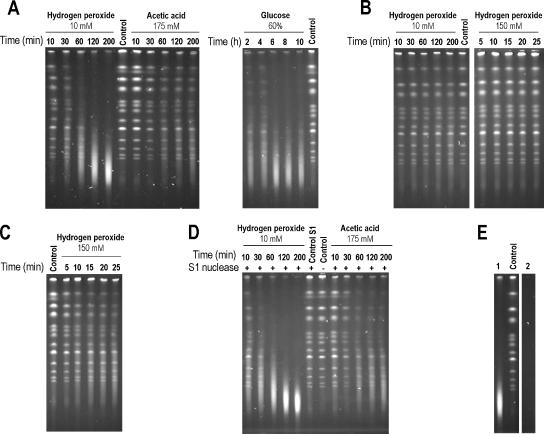
Figure 5.
Genomic DNA analyzed by PFGE from viable cells (A and C–E) or fixed S. cerevisiae cells (B). Cells were exposed to 10 mM hydrogen peroxide, 175 mM acetic acid, pH 3.0, 60% (wt/wt) glucose, or 150 mM hydrogen peroxide as indicated in the figure. Lanes marked as control were loaded with DNA isolated from exponentially growing cells without further treatment. Samples were collected after various periods as indicated (minutes) except for treatment with 60% (wt/wt) glucose, where time points are indicated in hours. (D) Cells were exposed to 10 mM hydrogen peroxide or 175 mM acetic acid, pH 3.0, and isolated chromosomal DNA was subsequently treated with S1 nuclease to degrade nicked DNA. Lane marked control S1 is similar to control lanes, but the DNA was treated with S1 nuclease before PFGE. (E) Lanes 1 and 2 show chromosomal DNA from nontreated cells, digested with N.BbvCIA nicking endonuclease (1) or DNaseI (2).

