Figure 7.
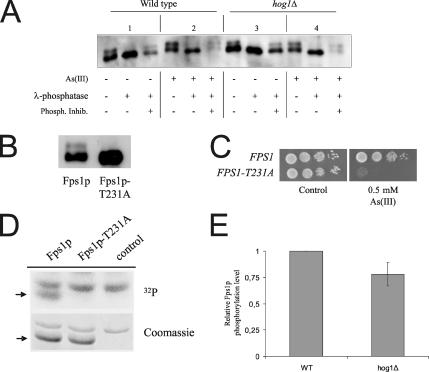
Fps1p is phosphorylated on threonine 231. (A) Fps1p is phosphorylated in vivo. Membrane proteins were isolated from treated or untreated cells (1 mM As(III) for 1 h) expressing c-myc–tagged Fps1p and probed with anti-c-myc antibodies. Protein extracts were either untreated or incubated with λ-phosphatase (200 U, 15 min, 30°C). For phosphatase inhibition, 24 μM sodium orthovanadate was added to the reaction. (B) Fps1p is phosphorylated on T231. Western blot analysis of protein extracts from cells expressing c-myc–tagged wild-type Fps1p and Fps1p-T231A. (C) Expression of Fps1p-T231A sensitizes cells to As(III). Wild-type cells were transformed with a plasmid containing Fps1p or Fps1p-T231A, and growth of the transformants was monitored after 2–3 d at 30°C. (D) Hog1p phosphorylates Fps1p on T231 in vitro. GST-Hog1p and GST-Pbs2pEE (constitutively activated version of Pbs2p) were incubated with GST-Fps1p (Fps1p), GST-Fps1p-T231A (Fps1p-T231A), or a control vector (control), purified from E. coli, in the presence of 32P-ATP. Phosphorylated GST-Fps1p and GST-Fps1p-T231A (arrow) were detected by autoradiography (top panel) whereas loading was monitored by Coomassie staining (bottom panel). (E) Hog1p affects Fps1p phosphorylation in vivo. Membrane proteins were isolated from wild-type and hog1Δ cells expressing c-myc–tagged Fps1p and probed with anti-c-myc antibodies. The amount of phosphorylated and total Fps1p was determined by quantifying the two electrophoretic mobility forms of Fps1p using the Multi Gauge software (Fuji Film). Relative Fps1p phosphorylation is shown where the level of phospho-Fps1p was set to 1 in wild-type cells. The data are based on quantifications from 10 independent experiments and the error bar represents SD.

