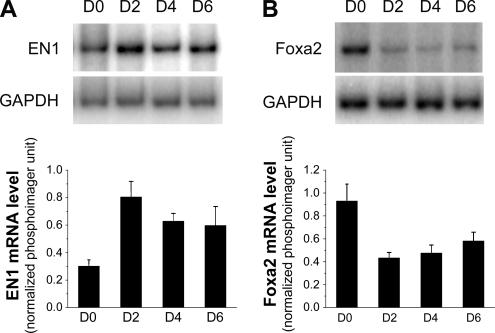
Figure 3.
Expression of the homeoprotein transcription factor EN1 and Foxa2 during CG4 differentiation. Increased EN1 expression (A) and reduced Foxa2 expression (B) upon induced differentiation of CG4 cells. Total RNA isolated from CG4 cells that had undergone various days of differentiation was subjected to a semiquantitative RT-PCR analysis using 32P-labeled primers specific for EN1 and Foxa2. RT-PCR of the housekeeping GAPDH mRNA was performed in parallel as an input control (top panel). Corresponding bottom panels show phosphorimager quantification of EN1 and Foxa2 expression upon CG4 cell differentiation. The signal at each time point was quantitatively measured and was normalized to that of GAPDH (n = 3). p < 0.05 based on one-way ANOVA.

