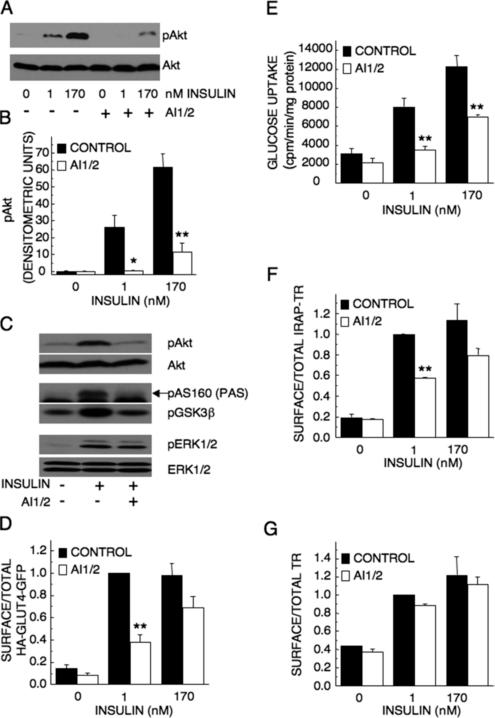
Figure 1.
Inhibition of Akt impairs GLUT4 translocation and glucose uptake in 3T3-L1 adipocytes. (A) 3T3-L1 adipocytes were treated with 1 μM AI1/2 or vehicle for 1 h before insulin stimulation for 15 min. Cell lysates were analyzed in immunoblots by using noted antibodies. (B) Densitometric analyses from pooled immunoblot data. The means ± SE of three independent experiments are shown. (C) Immunoblot analyses of adipocytes stimulated with 1 nM insulin for 15 min. As noted, some samples were treated with 1 μM AI1/2 for 1 h before insulin stimulation. Phosphorylated AS160 (arrow) was detected with the PAS antibody. (D) Surface-to-total distribution of HA-GLUT4-GFP. Each bar is the mean ± SE of three independent experiments. The surface-to-total HA-GLUT4-GFP distribution was normalized to the distribution in cells stimulated with 1 nM insulin for 30 min. As noted, some samples were treated with 1 μM AI1/2 for 1 h before 30-min insulin stimulation. (E) Glucose uptake in adipocytes. Cells were treated with vehicle or 1 μM AI1/2 for 1 h before 30-min insulin stimulation. Each bar is the mean ± SE of four independent experiments. (F and G) Surface-to-total distribution of IRAP-TR chimera (F) and TR (G) in adipocytes. Cells were treated with vehicle or 1 μM AI1/2 for 1 h before 30-min incubation in insulin. Each bar is the mean ± SE of two independent experiments. The surface-to-total distributions were normalized to the distribution in control cells stimulated with 1 nM insulin. *p < 0.05, **p < 0.01 versus cells that were not treated with AI1/2 (analysis of variance [ANOVA]).

