Figure 5.
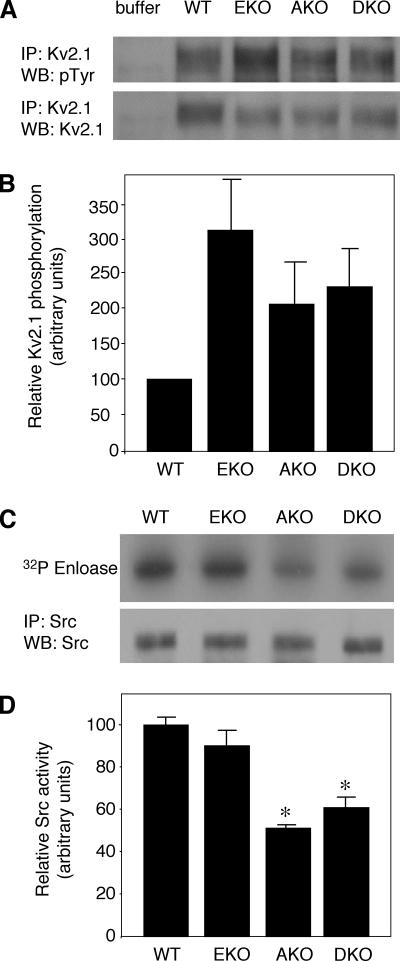
Phosphorylation of Kv2.1 and Src activity in sciatic nerves of WT, EKO, AKO, and DKO mice. (A) Crude membrane fractions of sciatic nerves from 3-d-old WT, EKO, AKO, and DKO mice were prepared and solubilized. After immunoprecipitation with anti-Kv2.1 antibodies, precipitates were blotted with anti-pTyr antibodies (top) followed by stripping and blotting with anti-Kv2.1 antibodies (bottom). Blots are from a representative experiment of four performed. (B) Bar diagram showing Kv2.1 phosphorylation intensity (± SEM) normalized to Kv2.1 protein content and presented relative to WT (= 100): EKO = 320.4 ± 105.8, AKO = 216.0 ± 58.3, and DKO = 231.8 ± 57.4; n = 4 repeats. (C) Src protein was immunoprecipitated from sciatic nerve extracts of 3- to 4-d-old mice and allowed to catalyze incorporation of 32P into enolase. Reaction mixture was subject to SDS-PAGE and blotting. Blot was exposed to document enolase-associated radioactivity (top) and then probed with anti-Src antibody to document amount of Src protein present in the precipitate (bottom). (D) Bar diagram showing relative Src activity (± SEM) in the four genotypes studied: WT = 1.00 ± 0.04; EKO = 0.89 ± 0.09; AKO = 0.50 ± 0.02; and DKO = 0.61 ± 0.05. n = 3–5 experiments per genotype. AKO and DKO are statistically different (asterisks) by Student's t test from WT (p ≤ 0.0006) and EKO (p ≤ 0.018). WT versus EKO and AKO versus DKO are not statistically distinct.

