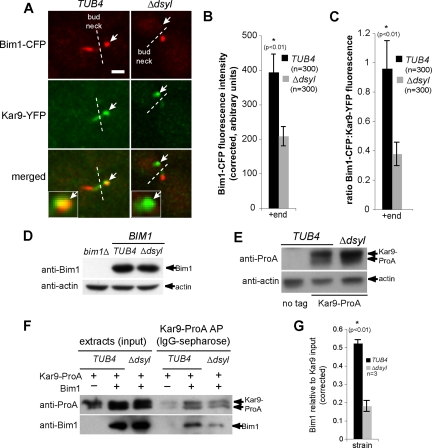
Figure 4.
Stoichiometry of Bim1–Kar9 complexes is reduced in tub4-Δdsyl cells. (A) In TUB4 cells, Bim1–CFP and Kar9–YFP are observed on microtubule +ends (white arrows). In contrast, Kar9–YFP foci are detected on +ends lacking detectable Bim1–CFP (white arrows) in the majority of tub4-Δdsyl cells. White dashed line indicates bud neck. Bar, 2 μm. (B) Quantification of Bim1–CFP fluorescence indicated that the amount of Bim1 localized to microtubule +ends is significantly reduced in tub4-Δdsyl cells relative to wild-type (p < 0.01). (C) The ratio of Bim1–CFP/Kar9–YFP fluorescence is greater in TUB4 cells (0.958 ± 0.224 arbitrary fluorescent units) relative to tub4-Δdsyl cells (0.377 ± 0.078 arbitrary fluorescent units). (D and E) Bim1 and Kar9 protein levels in tub4-Δdsyl cells are similar to those in TUB4 cells. Actin acts as a loading control. (F) Bim1 copurifies with Kar9–ProA in wild-type and tub4-Δdsyl cells, but the level of Bim1 copurification is reduced in tub4-Δdsyl cells. (G) Histogram showing the averaged amount of copurifying Bim1 (arbitrary units normalized to the Kar9–ProA input) in three independent experiments for wild-type and tub4-Δdsyl strains.

