Figure 3.
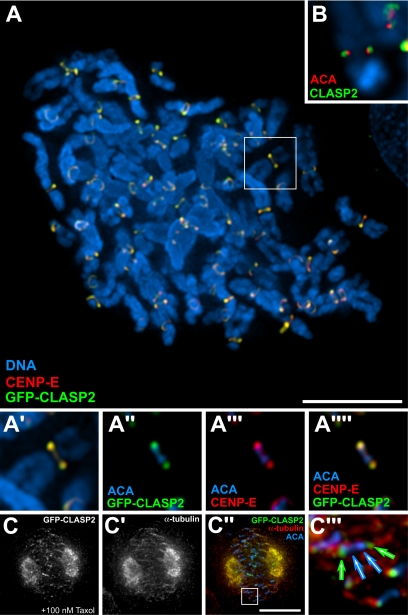
Mapping of the kinetochore localization of human CLASP2 and its dependence on MT dynamics. (A) Colocalization of EGFP-CLASP2 (green) with DNA (or ACA in the higher magnification pictures; blue) and CENP-E (red) in chromosome spreads after treatment with colcemid. In the merged images, colocalization of EGFP-CLASP2 and CENP-E is yellow. (A′–A″″) Interpolated zoom of the selected chromosome from A. (B) Colocalization of endogenous CLASP2 (green) with ACA (red) in chromosome spreads after treatment with colcemid. DNA is in blue. (C–C″) Redistribution of EGFP-CLASP2 after suppression of MT dynamics by incubation with 100 nM taxol. (C‴) Interpolated zoom of the selected region in C″. Note that EGFP-CLASP2 still localizes to kinetochores. Bar, 10 μm.

