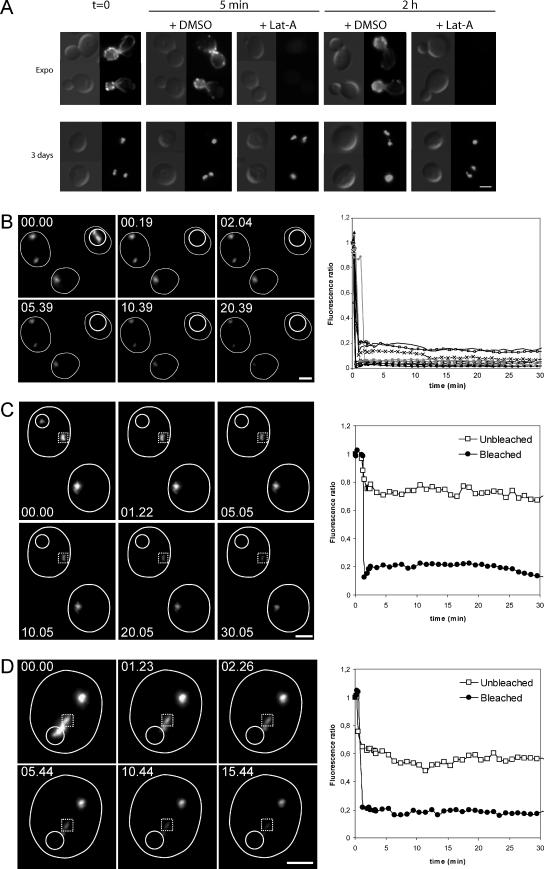
Figure 4.
Actin bodies contain stable actin filaments. (A) Actin bodies are resistant to latrunculin A (A). Wild-type cells were grown at 30°C in YPDA medium. During exponential growth (top) or after 3 d of culture (bottom), cells were incubated 5 min or 2 h with either 200 μM Lat-A or dimethyl sulfoxide as a control. Cells were then fixed and stained with Alexa-phalloidin. (B) Fluorescence recovery after laser ablation of the Abp1p-3xGFP signal of an actin body in a cell with a single actin body. Wild-type cells expressing Abp1p-3xGFP were grown for 3 d at 30°C in SD casa medium. Images on the left are 2D maximal projection of 3D image stacks time-lapse series. Time is indicated in the top left corner. The small white circle indicates the bleached region. The graph on the right shows the kinetics of fluorescence course obtained for 10 different cells. The same kind of curves was obtained for 32 cells. (C) Fluorescence recovery after laser ablation of the Abp1p-3xGFP signal of an actin body in a cell displaying two actin bodies. Wild-type cells expressing Abp1p-3xGFP were grown for 3 d at 30°C in SD casa medium. Images on the left are 2D maximal projection of 3D image stacks time-lapse series. Time is indicated in the top left corner. The small white circle indicates the bleached region; the dotted line square indicates the unbleached actin body in the same cell. The graph on the right shows the kinetics of fluorescence course measured for the bleached (black dots) and the unbleached (open squares) regions. The same kind of curve was obtained for 12 different cells. (D) Fluorescence recovery after laser ablation of the Abp1p-3xGFP signal of one-half of an actin body. Wild-type cells expressing Abp1p-3xGFP were grown for 3 d at 30°C in SD casa medium. Images on the left are 2D maximal projection of 3D image stacks time-lapse series. Time is indicated in the top left corner. The small white circle indicates the bleached region; the dotted line square indicated the unbleached region of the same actin body. The graph on the right shows the kinetics of fluorescence course measured for the bleached (black dots) and the unbleached (open squares) regions. The same kind of curve was obtained for 14 different actin bodies. Bar, 2 μm.

