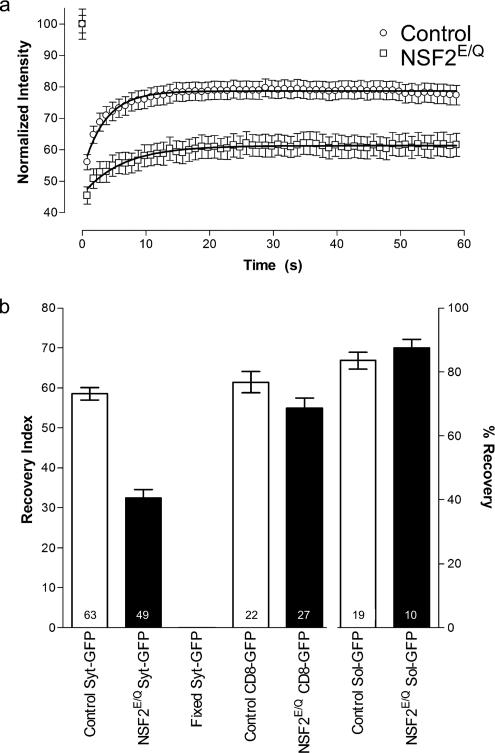
Figure 2.
Summary of FRAP analysis. (a) The time course of fluorescence intensity changes. The symbols represent the mean value from each of control and NSF2E/Q boutons at each time point. Error bars, SEM. Lines are best fit to the one-phase exponential equation y = A(1 − e(−k/x)) + B. (b) Summary of recovery index values, where the bars represent the mean value and the error bars the SEM for each of the genotypes and conditions indicated. The right axis, % recovery, applies only to the pair of sol-GFP bars. Sample size: n = number of boutons is indicated on each bar; the number of larvae were control, 9; NSF2E/Q, 6; fixed, 2; control CD8-GFP, 2; NSF2E/Q CD8-GFP, 2; control sol-GFP, 2; and NSF2E/Q sol-GFP, 2.

