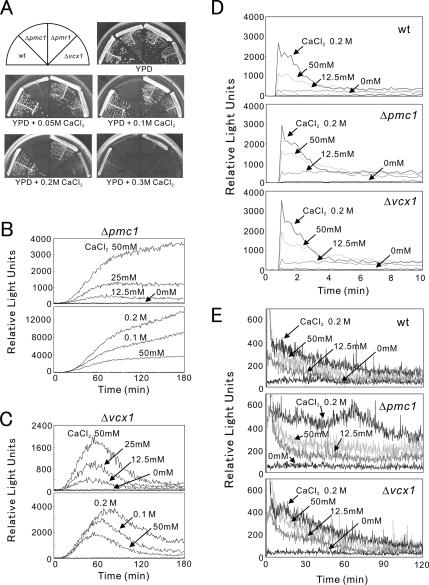
Figure 3.
The Δpmc1 cells are hypersensitive to CaCl2 and showed an enhanced CDRE reporter response to CaCl2. (A) Wild-type, Δpmc1, Δpmr1, or Δvcx1 cells were streaked onto each plate containing YPD or YPD plus CaCl2 as indicated, then incubated for 3 d at 30°C. (B and C) Live-cell monitoring of calcineurin activity in Δpmc1 and Δvcx1 cells. Experiments were performed as described in the legend of Figure 2A. The data shown are representative of multiple experiments. (D) Peak response of intracellular Ca2+ monitoring after the addition of CaCl2. Wild-type, Δpmc1 or Δvcx1 cells were transformed with pREP1-AEQ, and their intracellular Ca2+ levels were monitored during the first 10 min (see Materials and Methods). CaCl2 was added at 1 min after the start of monitoring. The data shown are representative of multiple experiments. (E) Monitoring of the postshock steady-state cytosolic Ca2+ concentration in wild-type, Δpmc1, or Δvcx1 cells. The same cells as described in D were monitored for 2 h. The data shown are representative of multiple experiments.

