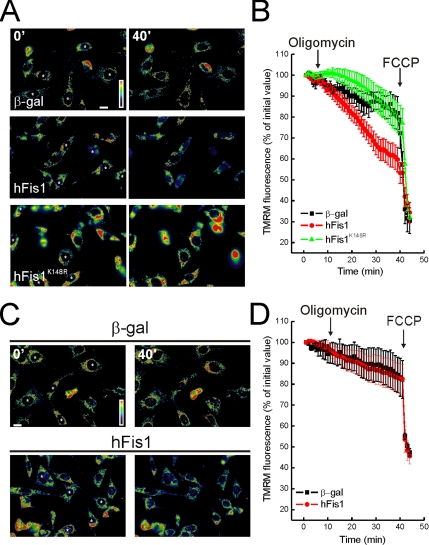
Figure 4.
DKO cells are resistant to mitochondrial dysfunction induced by hFis1. (A and C) Pseudocolor-coded, representative images of TMRM fluorescence intensity in wt (A) and DKO (C) cells at 5 (5′) and 40 min (40′) of the acquisition sequence. MEFs cotransfected with GFP and the indicated plasmids (asterisks) after 24 h were loaded with TMRM and imaged as described. Oligomycin (2.5 μg/ml) was added at min 3 of the sequence. (B and D) Quantification of the TMRM fluorescence changes over mitochondrial regions in wt (B) and DKO (D) MEFs. Experiments were carried out as A and C, respectively. Quantification procedure is described in the Materials and Methods. Where indicated (arrows), oligomycin (2.5 μg/ml) and FCCP (4 μM) were added.

