
Figure 2.
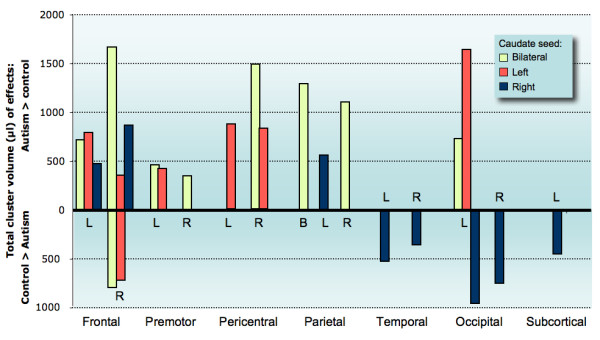
Overview of direct group comparisons. Each bar represents the total volume of effects (in μl) on group comparisons per subdivision of the brain (corresponding to the subdivisions used in Tables 1–3 ' [see additional file 1]'), shown separately for different seed volumes. Hemispheres of each brain subdivision are indicated by letters (L = left; R = right; B = bilateral). Upward bars show total fcMRI effects that were significantly stronger in the autism compared to the control group; downward bars show inverse effects (greater in control group). Note that for the right frontal lobe both upward and downward bars are shown because clusters of effects in both directions (autism > control; control > autism) were found in this part of the brain. No bars are shown for subdivisions without significant group differences.