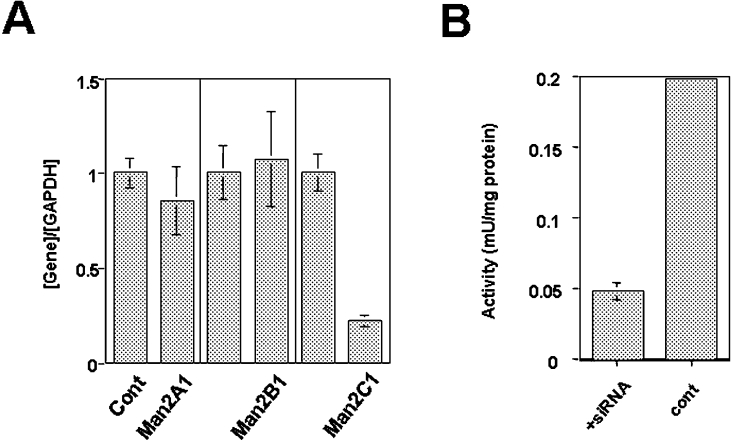
Figure 3. Suppression of Man2C1 expression by siRNA.
(A) Quantitation of mRNA by real-time PCR. Expression levels of Man2A1, Man2B1 and Man2C1 were normalized by the expression of GAPDH. The expression for each gene without siRNA treatment was set to 1 (left column). (B) Mannosidase activity in the cytosolic fraction was assayed using HEK-293 cells with (left-hand column) or without (right-hand column) siRNA treatment.

