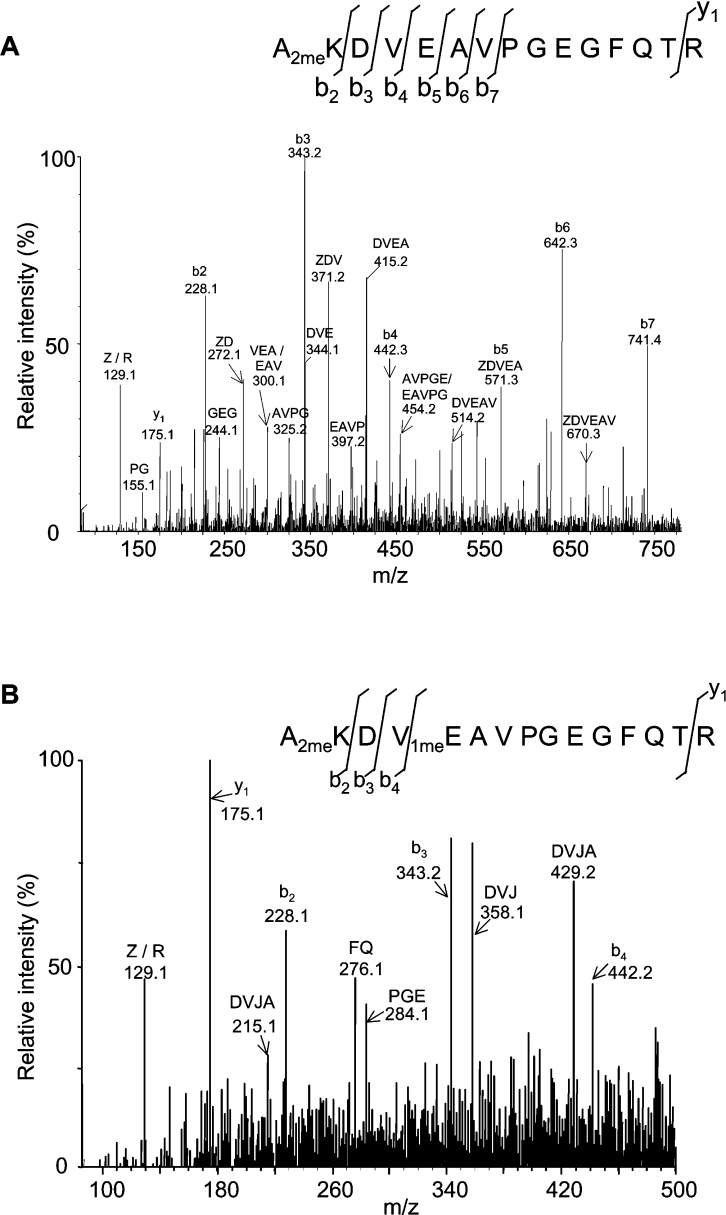
Figure 2. Representative sequence analysis of N-terminal PIP2;1 tryptic peptides from root PM.
Ala2–Arg16 peptides of PIP2;1 were analysed by ESI–MS/MS, and N-terminal (b-type), C-terminal (y-type) and internal fragments were used to interpret the spectra. Fragmented peptides are indicated according to either b and y series, or by their presumed sequence in the case of internal fragments. (A) Analysis was performed on the [M+2H]2+ species of 816.40 Da that corresponds to the [M+H]+ species of 1631.80 Da, as described in Table 3. The whole sequence can be deduced from the spectrum. The initiating methionine is cleaved. Lys3 is dimethylated (2meK). Z=K+28 Da. (B) Analysis was performed on the [M+3H]3+ species of 549.27 Da that corresponds to the [M+H]+ species of 1645.80 Da, as described in Table 3. The whole sequence can be deduced from the spectrum. The initiating methionine is cleaved. Lys3 is dimethylated (2meK), whereas Glu6 is monomethylated (1meE). Z=K+28 Da; J=E+14 Da.

