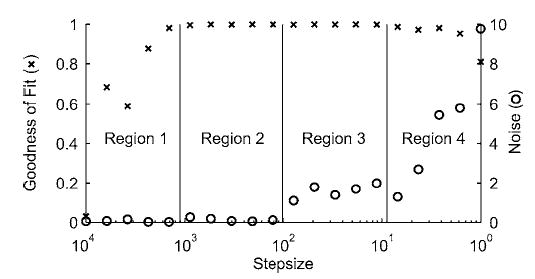
Fig. 6.

Automatic step size adjustment rationale to select sampled point spacing for an accurate cubic curve fit. Left axis is goodness of fit quantified using the adjusted R2 value, while right axis is noise quantified using the standard error of the estimate s. Four potential regions can be identified by combining R2 and s information: Region 1—R2<0.99, s<1; Region 2—R2>0.99, s<1; Region 3—R2>0.99, s>1; Region 4—R2<0.99, s >1. Knowledge of the region for the current fit can be used to adjust the sampled point spacing automatically (see text) until the fit is in region 2, where R2 is high and s is low.
