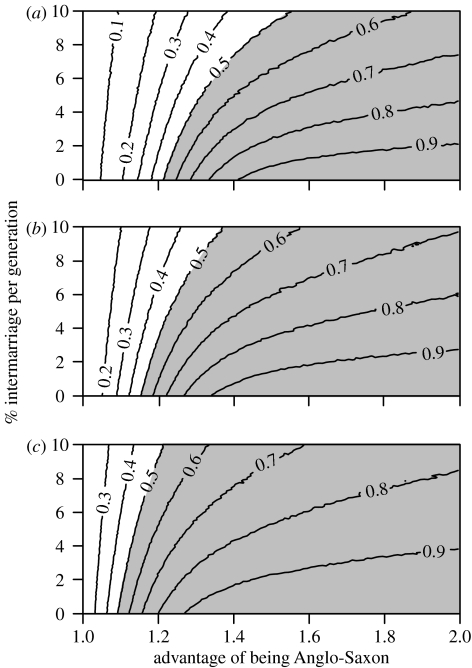
Figure 1.
The simulated proportion of ‘Anglo-Saxon’ Y-chromosomes in the total population, after 15 generations, under different combinations of selective advantage and intermarriage rate (U=D; see §2), assuming the population was made up of (a) 5%, (b) 10% and (c) 20% immigrants immediately following migration. Shaded area of graph indicates parameter combinations that lead to greater than 50% ‘Anglo-Saxon’ Y-chromosomes (Weale et al. 2002; Capelli et al. 2003).

