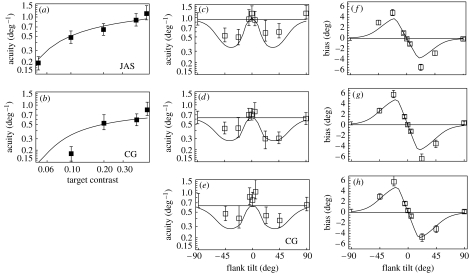
Figure 3.
Orientation identification: measurements and model fits. Panels (a, b) show that acuity increases with contrast in the absence of context. Panels (c–e) show acuity versus flank tilt (with respect to the reference orientation). Panels (f–h) show bias versus flank tilt. Error bars contain 95% confidence intervals. Curves adhere to a stochastic re-calibration model of orientation identification (see text). Parameter values for JAS (a, c and f) are: s=0.24, , μ=40° and σ=28°; for CG (b, d, e, g and h): s=0.34, , μ=44° and σ=28°. Points appearing with error bars on the left of panels (c–h) correspond to measurements made sans context. Horizontal lines correspond to model predictions for this condition.

