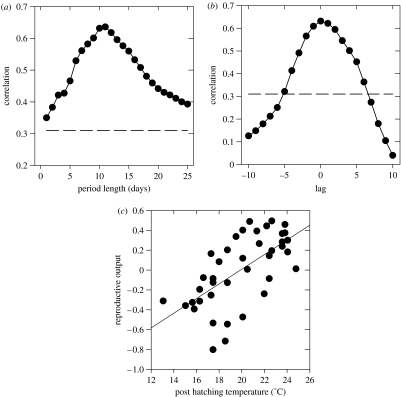
Figure 2.
(a) Cross-correlations of mean maximum temperature with reproductive output for post-hatching periods of different lengths (N=40). The dashed line marks the level of significance. (b) Cross-correlations of mean maximum temperature with reproductive output for subsequent10 day periods. The lag indicates the starting day of the period in respect to the annual mean hatching date (which is set at 0). (c) Relationship between mean maximum temperature of 10 day post-hatching period and reproductive output (residuals of young bird density regressed on adult density), r=0.63, P<0.001, N=40.

