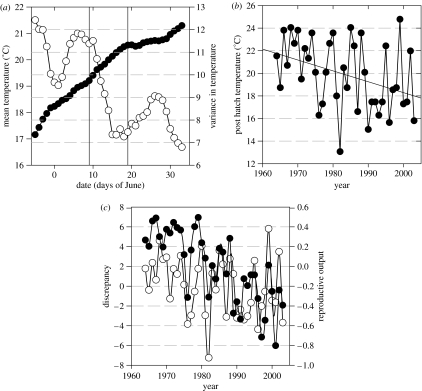
Figure 3.
(a) Mean maximum daily temperature (filled circles) and its variance (open circles) of subsequent 10 day windows in early summer for the period 1964–2003. The date indicates the start of the 10 day period. The range of expected mean hatching date is demarcated with vertical lines. (b) Experienced conditions (mean maximum daily temperatures) during the first 10 days as a function of time. (c) Time-series of reproductive output (filled circles) and the deviation of expected and observed post-hatching conditions (discrepancy, open circles) plotted against time.

