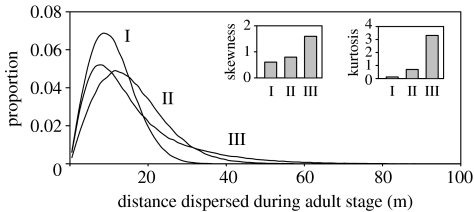
Figure 3.
Comparison of dispersal curves generated using three different random walk models (data for females; 1963–1990 period): I, a fixed-step model (mean=11.0 m; mode=8.5); II, a model assuming within-individual variation in step distance (mean=15.7 m; mode=11.5) and III, a model assuming both within- and between-individual variation in step distance (mean=15.7 m; mode=7.6). Mean daily movement in all models=2.04 m. Inset figures show relative skewness and kurtosis for each model.

