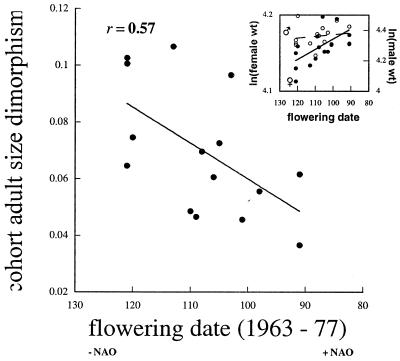
Figure 4.
Relationship between cohort-specific adult sexual size dimorphism [ln(male wt)/ln(female wt)] and plant phenology (the first flowering date of A. nemorosa) in the cohort’s year of birth (Julian flowering date). Note the x axis is reversed to represent the same NAO gradient as in Fig. 3. (Inset) Least-squares estimates of cohort-specific mean weights of adult males and females in relation to plant phenology in their year of birth (males: r = −0.16, P = 0.56; females: r = −0.61, P = 0.017). Bold, P < 0.05.

